 |
||
| Bookings by Patron Type[1] | ||||||||||||||||||
| Count | Percent | |||||||||||||||||
| Patron Types | 2019/2020 | 2020/2021 | 2021/2022 | 2022/2023 | 2023/2024 | 2019/2020 | 2020/2021 | 2021/2022 | 2022/2023 | 2023/2024 | ||||||||
| Adjunct Faculty | ||||||||||||||||||
| Alumni | 1 | 0.85% | ||||||||||||||||
| Collaborative Faculty | ||||||||||||||||||
| Conservatory | ||||||||||||||||||
| Contract | ||||||||||||||||||
| Community/Public | ||||||||||||||||||
| Faculty Exchange Prof. | ||||||||||||||||||
| Graduate Student | 14 | 1 | 8 | 8 | 5 | 3.03% | 3.03% | 8.79% | 6.84% | 4.59% | ||||||||
| Non-credit/Audit | ||||||||||||||||||
| Others as Authorized | ||||||||||||||||||
| Post Doc Fellow | ||||||||||||||||||
| Post Grad (PhD) | 2 | 2 | 5 | 6 | 0.43% | 2.20% | 4.27% | 5.50% | ||||||||||
| Reciprocal | ||||||||||||||||||
| Research Associate | 3 | 0.65% | ||||||||||||||||
| Research Fellow | ||||||||||||||||||
| Retired Fac./Staff | ||||||||||||||||||
| Sessional | 7 | 1 | 2 | 3 | 1.52% | 3.03% | 1.71% | 2.75% | ||||||||||
| Staff | 253[2] | 8 | 42 | 32 | 26 | 54.76% | 24.24% | 46.15% | 27.35% | 23.85% | ||||||||
| ULFA faculty | 66 | 10 | 5 | 17 | 14 | 14.29% | 30.30% | 5.49% | 14.53% | 12.84% | ||||||||
| Undefined (-) & No Code | ||||||||||||||||||
| Undergraduate | 117 | 13 | 34 | 52 | 55 | 25.32% | 39.39% | 37.36% | 44.44% | 50.46% | ||||||||
| Visiting Prof. | ||||||||||||||||||
| TOTALS | 462 | 33 | 91 | 117 | 109 | 100% | 100% | 100% | 100% | 100% | ||||||||
| Bookings by Location[3] | ||||||||||||||||||
| Count | Percent | |||||||||||||||||
| By Collection | 2019/2020 | 2020/2021 | 2021/2022 | 2022/2023 | 2023/2024 | 2019/2020 | 2020/2021 | 2021/2022 | 2022/2023 | 2023/2024 | ||||||||
| AV Equipment | 4 | 3.42% | ||||||||||||||||
| Media Collection | 52 | 26 | 15 | 24 | 12 | 11.26% | 78.79% | 16.48% | 20.51% | 11.01% | ||||||||
| Main Collection | ||||||||||||||||||
| Media Oversize | 2 | 0.43% | ||||||||||||||||
| AV Equipment | ||||||||||||||||||
| Remote Collection | 1 | 0.92% | ||||||||||||||||
| General Services Desk | 408 | 7 | 76 | 88 | 96 | 88.31% | 21.21% | 83.52% | 75.21% | 88.07% | ||||||||
| Reserve Collection | ||||||||||||||||||
| Map Collection[4] | 1 | 0.85% | ||||||||||||||||
| TOTALS | 462 | 33 | 91 | 117 | 109 | 100% | 100% | 100% | 100% | 100.00% | ||||||||
|
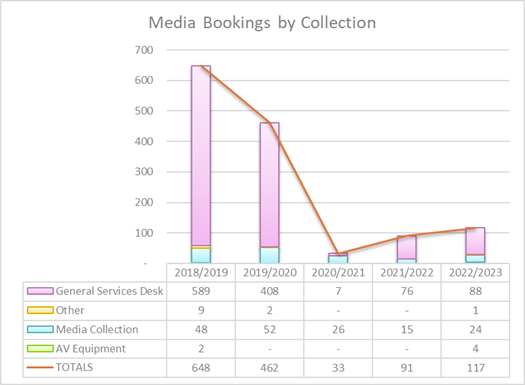
||||||||||||||||||
| Count | ||||||||||||||||||
| By Collection | 2019/2020 | 2020/2021 | 2021/2022 | 2022/2023 | 2023/2024 | |||||||||||||
| AV Equipment | - | - | - | 4 | - | |||||||||||||
| Media Collection | 52 | 26 | 15 | 24 | 12 | |||||||||||||
| Other | 2 | - | - | 1 | 1 | |||||||||||||
| General Services Desk | 408 | 7 | 76 | 88 | 96 | |||||||||||||
| TOTALS | 462 | 33 | 91 | 117 | 109 | |||||||||||||