| Distributed Stations | ||||||
|
|
||||||
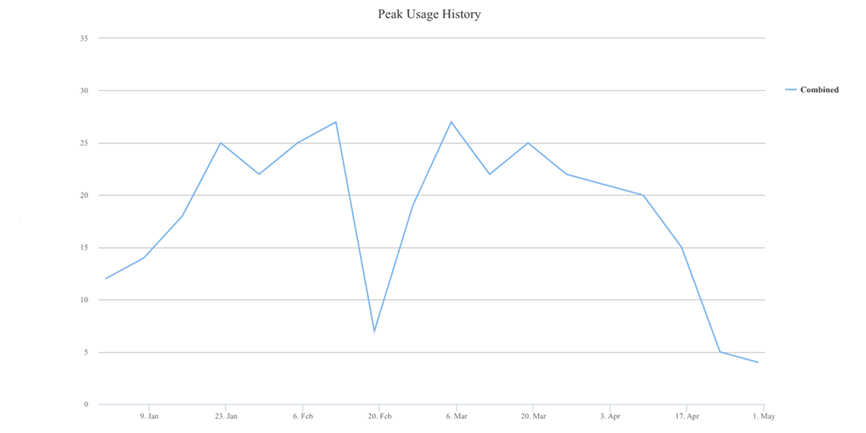
| <Insert Max Concurrent Usage graph (day of the week)> | ||||||
| Unique Users | Logins | Total Usage (hours) | Avg Duration (hours) | Stations Used (Total: 91)[1] | ||
| January[2] | 462 | 1953 | 1406 | 0.72 | 89 | |
| February | 445 | 1801 | 1705 | 0.95 | 90 | |
| March | 544 | 3091 | 2865 | 0.93 | 90 | |
| April | 334 | 1463 | 1330 | 0.91 | 86 | |
| Total | 981 | 8308 | 7306 | 0.88 | 90 | |